Clarity
Complete monitoring of seeders and strip-till bars
Equipped for
WHAT IS CLARITY
See Inside Your Strip-Till Bar
Complete Implement Monitoring
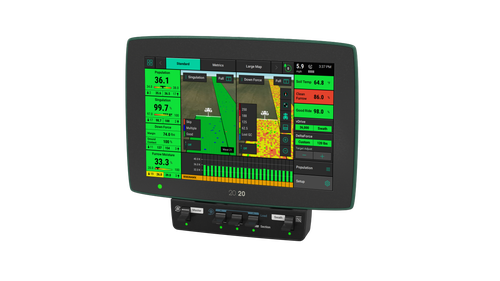
High-Definition Visibility With the 20|20
The Clarity system displays and maps blockage variability and product blockage metrics, row-by-row, on the 20|20 monitor in the cab. Clarity shows you more than simply when a run is blocked; you'll see numbers and statistics tied to the performance of the product delivery system, giving you more accuracy than standard systems on the market.
Faster Awareness of Performance Issues
With the 20|20 in the cab, you can identify problems while still in the field, rather than after the crop emerges. Catch product flow and pressurization issues in real-time. Don't let your crop suffer from an undetected issue.
Row-by-Row Monitoring
Clarity monitors product distribution, air pressure and fan speed on strip-till bars through the 20|20 with detailed data per row. Pinpoint if there’s a blockage or drop in pressure more accurately. If you’re applying more than one granular product and you have a reduction in flow of one of those products, Clarity will let you know so that you can find the problem and fix it before it costs you.
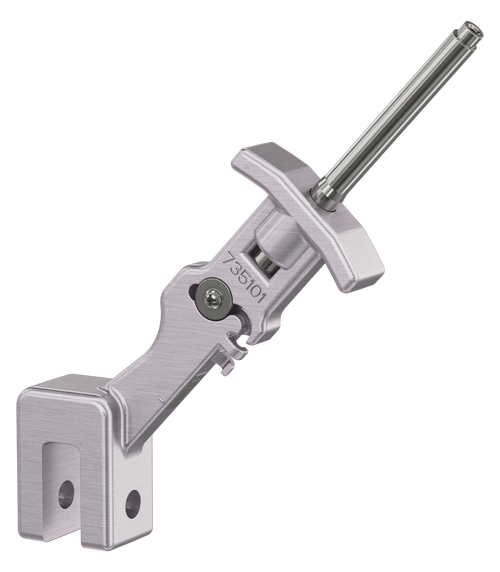
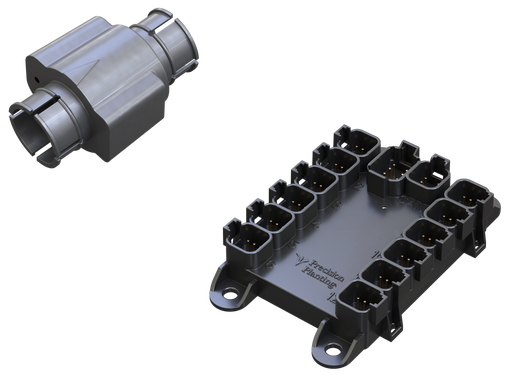
How Does the Blockage Sensor Work?
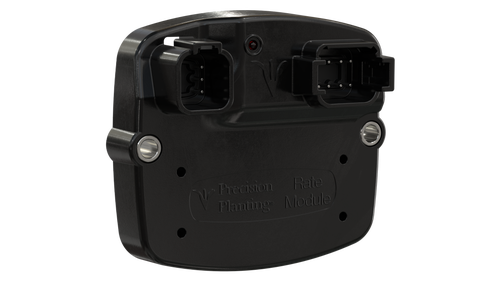
The Clarity system uses optical blockage sensors that you may already have on your equipment, paired with a Blockage Expansion Module and a Gen 3 20|20 monitor. If you're in need of blockage sensors, Precision Planting has those too.
Clarity processes the optical signal differently than other systems, by looking at the percentage of time that product is detected by the sensor. This percentage is then converted to Magnitude, Uniformity and Deviation metrics that allow you to put hard numbers on the product distribution across the tool rather than seeing only flow or no flow.
Your Machine. Your Control.
Watch this Clarity demonstration to see how you can take control.
CUSTOMIZE YOUR VIEW
Take control of the data you collect and how you view it.
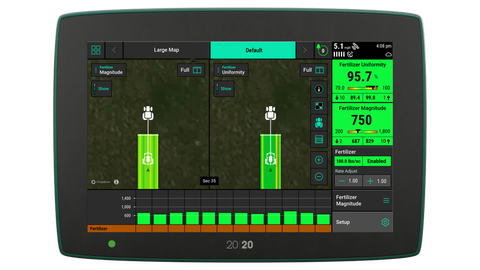
Blockage Metrics
Product Magnitude
Shows the amount of product flowing through the sensors, giving you a row-by-row comparison. By watching this metric on the 20|20 monitor, you can quickly see any inconsistencies of product flow and investigate issues.
Product Uniformity
A numerical percentage value that shows how even the system is delivering a product to each row. By using the product magnitude data, the system shows the distribution error across the implement, in a row-by-row average.
Product Deviation
Displays how each row compares to the average magnitude being applied. This metric shows the percentage that a row is applying above or below the average.
Additional Metrics
Air Pressure
Measures the tank and meter pressure differential (in inches of water) to diagnose pressurization failures that cause erratic seeding performance.
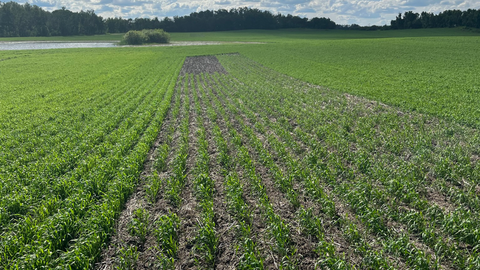
All About Strip Till
InsidePTI S2•E38 | Strip-Till [Fall vs. Spring]
In a 2020 study, we saw a 17.6 Bu/A yield increase using strip-till bands rather than broadcasting fertilizer.
InsidePTI S1•E64 | Strip-Tilling
Hear a strip-till 101 from Jason Webster, Commercial Agronomist at Precision Planting.
InsidePTI S4•E07 | Strip-Till Liquid vs. Dry Fertilizer
We have started comparing liquid to dry fertilizer in our fall strip-till testing program at the PTI Farm.
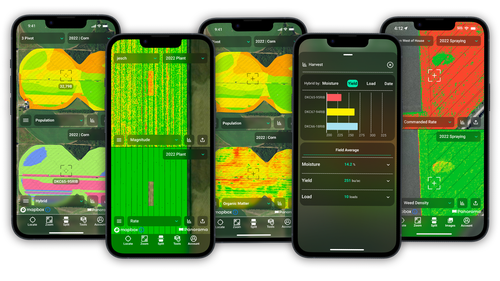
Manage 20|20 maps and data in Panorama™
- View, share, and analyze 20|20 data everywhere.
- See data in row-by-row maps, field average reports, and yield comparisons.
- Automate the process of sending data from your 20|20 to other trusted platforms.
Product Resources
Clarity Resources
Download the operator's guide and watch setup videos here!