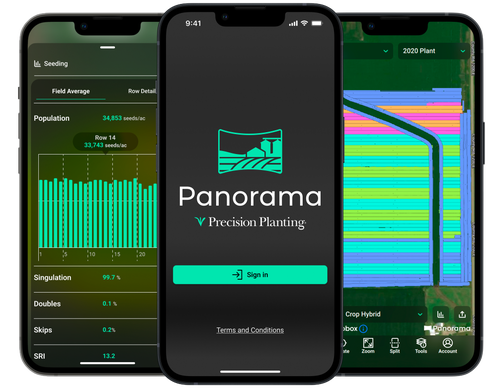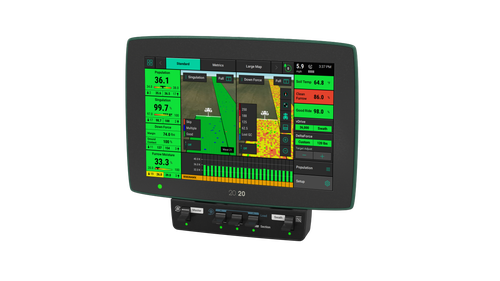
Accurate agronomic data from each pass throughout the growing season is crucial in ensuring you have the context needed to make informed decisions for your next pass and next season. With a connected 20|20 and Panorama, you can easily view and analyze field data from your phone, computer or platform of choice, giving you the information you need at your fingertips.
Panorama is not only a great tool for in-season data analysis and support, it's reporting features and functionality enable you to create a variety of customizable reports that give a holistic view of the growing season.
Three different report types are available within Panorama:
- Input
- Condensed
- Agronomic
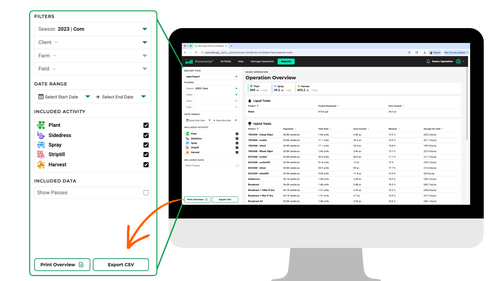
Each type of report can be populated by the entire crop season or drilled down to be viewed by the client, farm and field depending on the level of granularity you are after. Additionally, you can select which activities from the season should be included in the report: Plant, Sidedress, Spray, Striptill and Harvest.
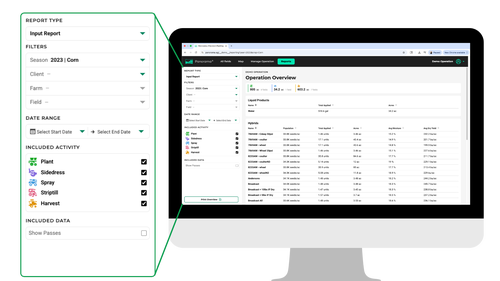
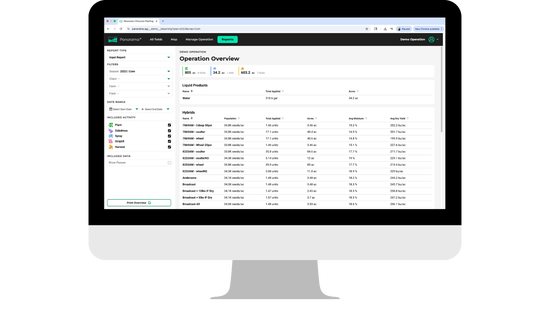
Input Reports
The Input Report lists totals for each product applied throughout the season as well as key averages that give you a holistic view of how each input performed. With the ability to sort by a variety of factors, you can easily determine which hybrid, liquid or granular product offered the greatest return on investment.
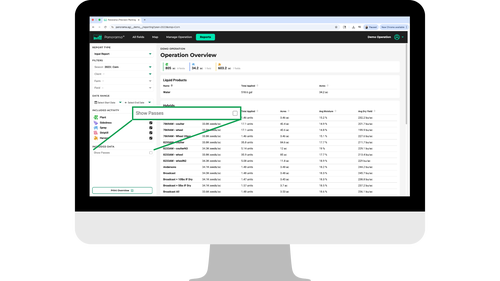
Several filters are available for viewing Input Reports. Adding or removing filters will increase or decrease the length and level of detail within the report. To see a breakdown of input use and performance at the individual field level, select Show Passes from the Included Data menu.
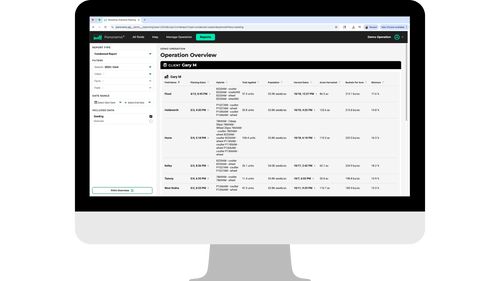
Condensed Reports
The Condensed Report feature provides a high-level overview of key planting and harvest details. With information broken down by client, farm and field, you can quickly reference planting and harvest dates, hybrids, population, yield and moisture.
Agronomic Reports
The Agronomic Report is the most complex of the three reports. Like the Input Report, you can filter by field workflow; however, the Agronomic Report takes the analysis one step further, allowing you to view any data that was captured by the 20|20 or uploaded to Panorama throughout the growing season.
With all filters enabled, you can analyze all factors at play that may have impacted the successfulness of your crop. See weather data during each field activity as well as complete averages of in-field statistics like singulation, skips, furrow moisture and downforce that were captured by the 20|20.
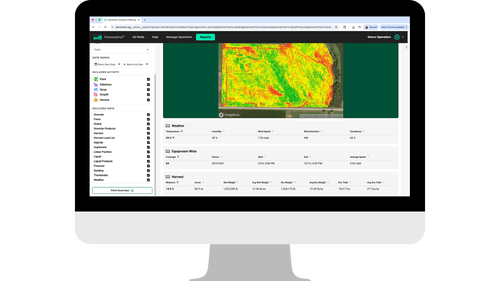
Select the thumbnail filter to include a screenshot of the map layer within the report.
Exporting Reports
Two options are available for exporting reports: Print Overview and Export CSV. Print Overview creates a PDF version of the report that can be exported and printed. Export CSV creates a Comma-Separated Values file that can easily be converted to a spreadsheet when opened with platforms like Excel or Google Sheets.
To export for print, select Print Overview and save the document to your computer. Selecting Export CSV will automatically trigger the download to your device where the file can now be found.
By bringing all your in‑season data together in one connected platform, Panorama helps turn information into confidence. Whether you’re reviewing individual passes or evaluating the entire growing season, these reports give you the clarity needed to understand what worked, what didn’t and why. With clear insights and customizable views, Panorama empowers you to make smarter decisions for every field, every pass and every season ahead.