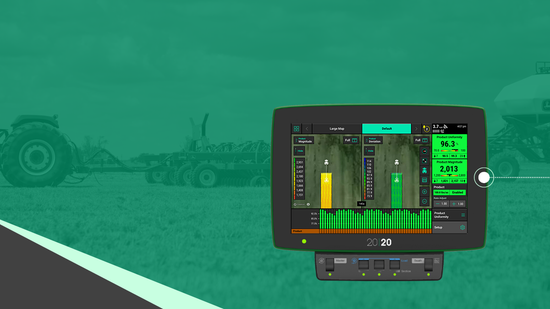
In-cab visibility to the performance of your air seeder has always been a challenge. High application rates, very small product sizes, and product blending all combine to make monitoring very difficult, especially with current blockage sensor technology.
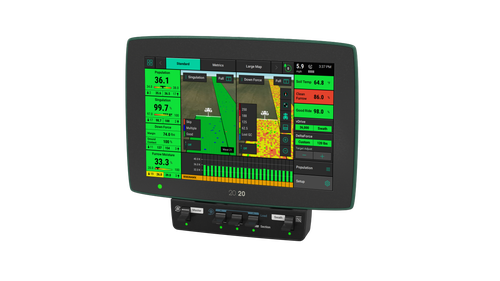
Your 20|20 paired with Clarity's blockage and flow monitoring system displays and maps flow variability and product blockage metrics in real time so you can diagnose and fix blockage issues before they happen. Learn more about each metric below:
- Product Magnitude - Magnitude is a relative rate metric showing the amount of product flowing through the sensors, giving you row-by-row comparison and the ability to quickly identify inconsistencies.
- Product Deviation - Deviation displays how each row compares to the average magnitude being applied. This metric shows the percentage that a row is applying above or below the average. You will be able to further diagnose performance issues using this metric.
- Product Uniformity - Uniformity represents the percentage difference of the row's magnitude versus the seeder’s average magnitude. This metric is an absolute value of product deviation.
All of these metrics are mapped on the 20|20 monitor in addition to showing their numerical value.
With 20|20 on your air seeder, you unlock this new visibility to application performance in addition to adding the capability to monitor and control downforce, control application rates, and section swath control.
Connect with a dealer near you today to get your customized air seeder or drill upgrade plan and make this your best season yet.